Request Limits issues with Azure SQL (Hyperscale)
Problem Statement
To understand the requests limit error message (error 10928, “Resource ID : 1. The request limit for the database is N and has been reached” ) that you can run into when working with Azure SQL and how to troubleshoot it. In this particular case we were working with Azure SQL Hyperscale, however the methodology can be extended to other versions of Azure SQL.
1. Application and Database details
1.1. Application Anatomy
A Java application that uses a JDBC to connect to the Azure SQL Database. Hibernate was being used as JDBC producer and the connection pool for the Application was being limited to 50 connections per each instance of the application being launched.
For a single instance of the application, the problem was not happenning, however as soon as we started with some load testing we’ve intermitently ran into the request limit issue.
2. Database Limits
We were using Azure SQL Hyperscale Gen5_16 with the following limits:
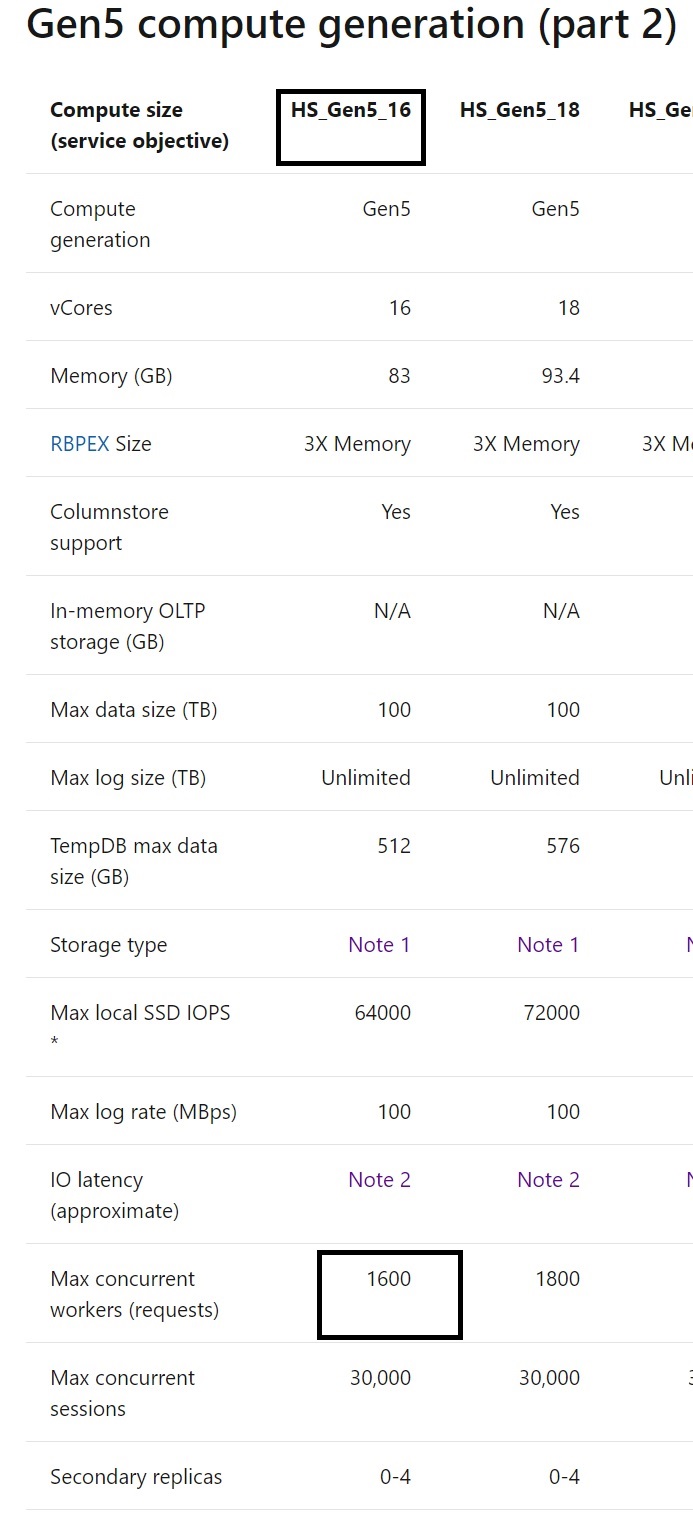
More Information on limits available here: Azure SQL Resource Limits
2.1 Understanding the difference between Max concurrent workers and Max concurrent sessions
Max concurrent sessions represents the number of active sessions on the server on any status - including sleeping.
Max concurrent workers represents the number of runnable or suspended sessions on the server.
In our case we were interested in looking at the Max concurrent workers values.
3. Troubleshooting the application
From past experiences we know that there are some reliability issues between the JDBC driver and Azure SQL databases if the right configurations are overlooked. One of our issues was exactly identified in this blog post specifically on the values of the connectionTimeout setting and the JDBC driver timeout setting - both were defined as 30 ms by default in our case. So the first solution we found was to change the following configuration to 40ms:
spring.datasource.hikari.connectionTimeout=40000
This step solved the issue on some of the load testing runs, however we continued to experience the issue on a later stage.
4. Troubleshooting the database
Having reconfigured the application and knowing that the connection pool limits were set not to overcome the database limits, it was time to take a different path to find the issue : the databas itself.
One of the signs we had was a higg CPU usage in some of those runs, that fact lead us to think that the problem could be on the Max Degree of Parallelism of the database.
The Max degree of parallelism is a setting that determines how the query execution is distributed among different cores in the server. Tradicionally the default setting for MAXDOP is 0, which means that the engine makes a dynamic allocation. In this case I was using 16 cores as per the selected provisioned compute, so that means that the SQL Engine could use from 1 to 16 cores to execute a single query.
4.1 Looking for CXPACKET wait type
With the excessive parllelism suspicious in mind, the next step was to confirm what the wait types in the connections were. By using Who Is Active stored procedure, we can get as much information as we need on the connections to the database plus the associated wait types. By running the stored procedure in a cycle and save the results on a table, we can later analyse what was going on on the database when we triggered the tests that were trowing the request limit exception.
4.1.1. Create a table to hold the results
CREATE TABLE [dbo].[WhoIsActive](
	[dd hh:mm:ss.mss] [varchar](15) NULL,
	[session_id] [smallint] NOT NULL,
	[sql_text] [xml] NULL,
	[login_name] [sysname] NOT NULL,
	[wait_info] [nvarchar](4000) NULL,
	[CPU] [varchar](30) NULL,
	[tempdb_allocations] [varchar](30) NULL,
	[tempdb_current] [varchar](30) NULL,
	[blocking_session_id] [smallint] NULL,
	[reads] [varchar](30) NULL,
	[writes] [varchar](30) NULL,
	[physical_reads] [varchar](30) NULL,
	[used_memory] [varchar](30) NULL,
	[status] [varchar](30) NULL,
	[open_tran_count] [varchar](30) NULL,
	[percent_complete] [real] NULL,
	[host_name] [sysname] NOT NULL,
	[database_name] [sysname] NOT NULL,
	[program_name] [sysname] NOT NULL,
	[start_time] [datetime] NOT NULL,
	[login_time] [datetime] NOT NULL,
	[request_id] [int] NULL,
	[collection_time] [datetime] NOT NULL
) ON [PRIMARY] TEXTIMAGE_ON [PRIMARY]
GO
4.1.2. Create sp_whoisactive stored procedure
Create the stored procedure in the database based on Who Is Active SP on GitHub
Check Who Is Active Docs for guidance on what options might be more useful for the troubleshooting exercise. On the example below the only argument I’ve used was the name of the output table where you may want to persist the results. But there is a variety of options you can use to identify head blockers, add information to the collection and much more.
EXEC sp_WhoIsActive @destination_table = 'dbo.WhoIsActive'
WAITFOR DELAY '00:00:30'
GO 60
This statement will run 60 times with 30 seconds delay in between. Be aware that different runs will overlap the data in the table. So if you want to save the results you need to use different output tables for the different runs.
Our results saved on the following tables with the following name pattern:
dbo.WhoIsActive_maxdop_<value>_<test_reference>_<test_result_for request_limit_issue>-<other_comment>
Ex:
- dbo.WhoIsActive_maxdop_1_test1_success
- dbo.WhoIsActive_maxdop_1_test2_success
- dbo.WhoIsActive_maxdop_8_test1_failure
- dbo.WhoIsActive_maxdop_4_test2_success-failure_deadlock
4.1.3. Analyzing the results
In this case we were looking specifically for the CXPACKET type of wait, which means that we would be facing excessive parallelism in the database. To my surprise, we didn’t encounter one single connection indicating a wait of this type. But I was still experiencing a high CPU usage and the request limit error.
4.2 MAXDOP Setting
Even with no CXPACKET type of wait, we had a strong believe that the root cause could be the parallelism setting, as we were running into a thread exaustion with no logical calculation from what was being produced on the application side. So our next step was to experiment the setting on the following order:
| MAXDOP Value | T-SQL Statement | Request Limit Error |
|---|---|---|
| MAXDOP = 1 (means disabled) | ALTER DATABASE SCOPED CONFIGURATION SET MAXDOP = 1 ; | Completely solved |
| MAXDOP = 8 | ALTER DATABASE SCOPED CONFIGURATION SET MAXDOP = 8 ; | Not solved and adittionally we encountered deadlocks exceptions. |
| MAXDOP = 4 | ALTER DATABASE SCOPED CONFIGURATION SET MAXDOP = 4; | Completely solved, but we ran into another unrelated error |
NOTE: recall that the number of cores being used was 16.
5. Conclusion
After finding the possible solution for this specific problem, we have ran into a very recent Microsoft article where tradicional default recommendation for MAXDOP has been changed to eight instead of zero.
The link is available here MAXDOP new setting recommendation
The default recommendations are settings that are supposed to work to the vast majority of cases. On some ocassions you really need to test out your application to find out the most suitable setting.
On our case and taking into account the selected compute option, the two values that solved the problem were MAXDOP = 1 or MAXDOP = 4.
Aditionally, it’s also true that fiding the CXPACKET type of wait is not the only way to detect excessive parallelism in the database.
It is actually great to have two options to select from to overcome an issue. A factor that may influence your decision is performance - which was very close for this two cases. At the end the only reason we decided to disabled the MAXDOP setting was because of another unrelated error.